들어가며
앞선 글들에서 Grafana Loki를 선택하게 된 배경과
전체 아키텍처 및 설계 원칙을 정리해 보았습니다.
- https://david-ahn.tistory.com/95
“Loki는 생각보다 단순하지 않았다” – 컴포넌트, 제약, 그리고 선택의 문제
0. 들어가며“Loki는 단순하다고 생각했습니다”Grafana Loki를 처음 접했을 때의 인상은 분명했습니다. 짧은 시간 동안 Hands-On 성격으로 Loki 단일 바이너리로 MinIo와 구성해 볼때만 해도 크게 어렵지
david-ahn.tistory.com
https://david-ahn.tistory.com/94
우리는 Loki를 ‘어떻게’ 설계했는가 – 전체 아키텍처와 설계 원칙
1. 이 글을 쓰는 이유앞에 글들에서는 https://david-ahn.tistory.com/92왜 Elasticsearch 중심의 로그 시스템을 유지할 수 없었는지기존 로그 아키텍처가 어떤 한계에 도달했는지위와 같은 이유를 중심으로
david-ahn.tistory.com
이번 글에서는 설계 이후 실제로 Loki를 구축하고 운영하는 과정에서 마주했던 다양한 문제들을 중심으로 이야기해보고자 합니다.
운영 단계에서의 대규모 장애보다는, Loki를 실제 환경에 올리며 하나하나 맞춰가던 과정에서 겪었던 시행착오에 가깝습니다.
문서만 읽을 때는 잘 보이지 않지만, 실제 로그가 흘러가고 컴포넌트들이 상호작용하기 시작하면 바로 드러나는 문제들이었습니다. 해당 글에서 총 16가지 여러 에러 케이스 핸들링 사례들을 소개 합니다.
1. Empty Ring 설정 문제
– “모든 컴포넌트는 살아 있는데 왜 제대로 동작을 하지 않을까?”
2025-04-29T01:50:21.753859659Z level=error ts=2025-04-29T01:50:21.670502433Z caller=ring_watcher.go:56
component=frontend-scheduler-worker msg="error getting addresses from ring" err="empty ring"
증상
- Loki 컴포넌트들이 정상적으로 떠 있음
- 하지만 로그 적재도 안 되고, 쿼리도 동작하지 않음
- 메트릭에는 ring empty, no healthy instances 같은 메시지 반복
원인
Loki의 여러 컴포넌트(Distributor, Ingester, Querier 등)는 Ring 기반으로 서로를 발견합니다. 이 Ring은 단순한 설정이 아니라, Loki 내부의 서비스 디스커버리이자 상태 공유 메커니즘입니다.
- memberlist / consul / etcd 중 하나를 선택해야 함
- 각 컴포넌트가 동일한 ring 설정을 공유하지 않으면, 서로를 “없는 존재”로 인식
초기에는 일부 컴포넌트에서 ring 설정이 누락되거나, 값이 미묘하게 달라 Empty Ring 상태가 발생했습니다.
문제 해결
memberlist:
join_members:
- loki-memberlist
ring:
kvstore:
store: memberlist
설정을 위와 같이 memberlist로 변경하고 member list 서비스가 뜨고 해당 서비스를 통해 특히 ring 기반 컴포넌트(ingester, distributor, ruler 등)들이 서로 상태를 공유하기 위해 memberlist 기반의 gossip 프로토콜을 사용하게 됩니다.
관련 메트릭
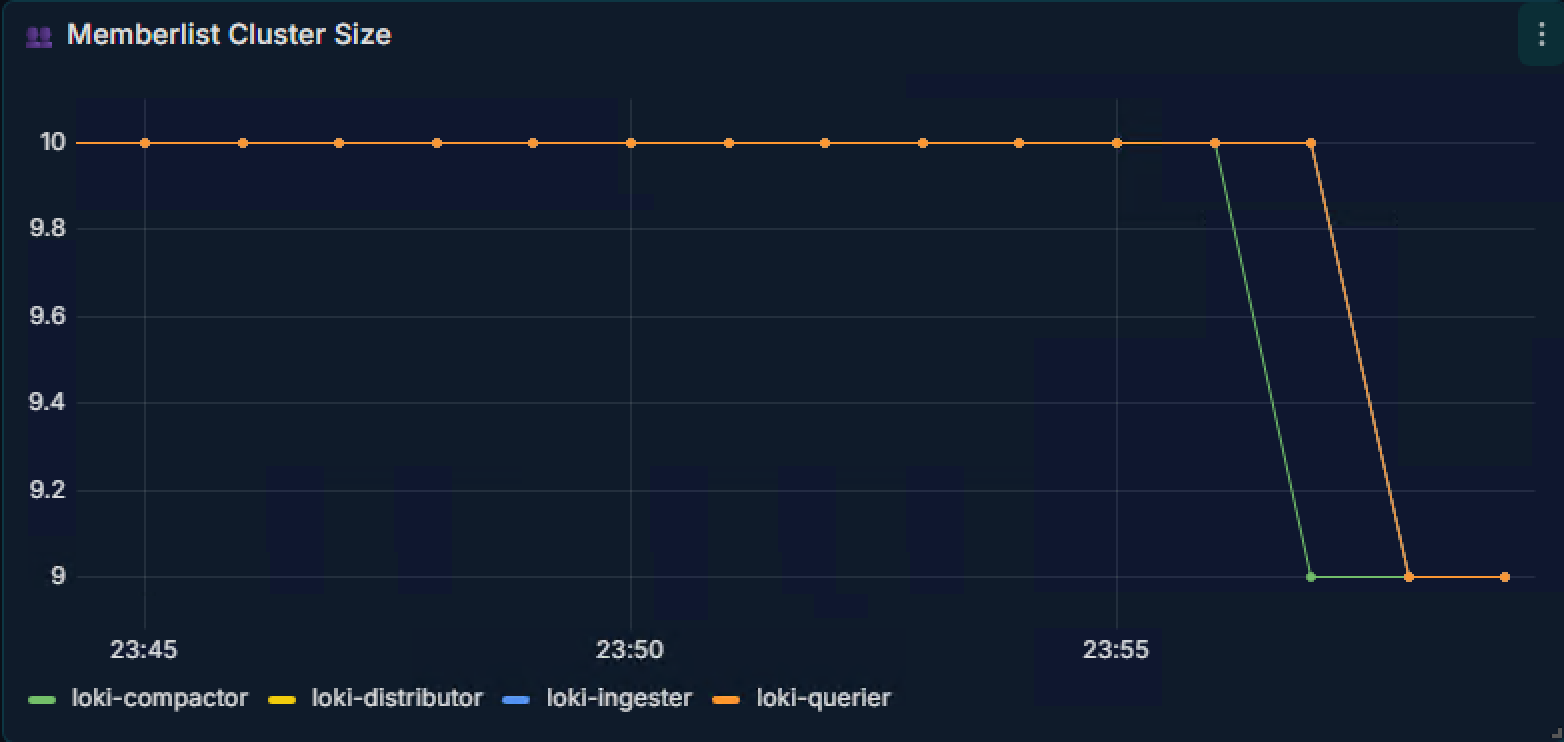
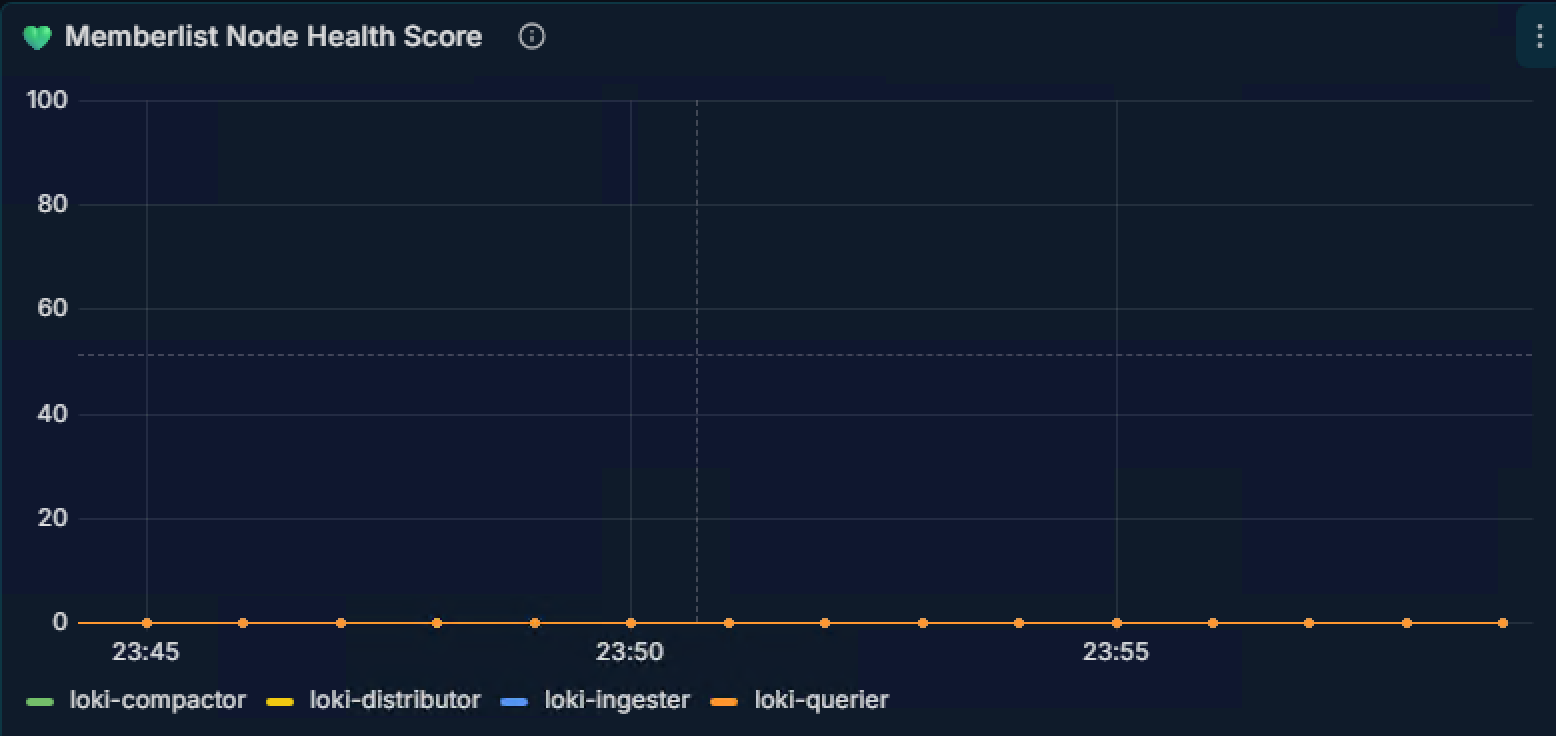
- Memberlist 관련되어 참고하면 좋을만 메트릭 값은 loki_memberlist_client_cluster_members_count, loki_memberlist_client_cluster_node_health_score 를 참고 하면 좋습니다.
참고
- memberlist 설정 참고 - https://community.grafana.com/t/memberlist-join-members-configuration-for-read-write-deployments/100086
- gossip 프로토콜 참고 - https://jins-dev.tistory.com/entry/%EA%B0%80%EC%8B%AD-%ED%94%84%EB%A1%9C%ED%86%A0%EC%BD%9C-Gossip-Protocol-%EC%9D%B4%EB%9E%80
가십 프로토콜 (Gossip Protocol) 이란?
가십 프로토콜 (Gossip Protocol) 이란 분산 환경에서 메시지를 전달하는 커뮤니케이션 방식의 하나이다. 외국에서는 바이러스가 퍼지는 방식으로 동작한다하여 Epidemic Protocol 과 동의어로 사용되기
jins-dev.tistory.com
Memberlist join_members configuration for read-write deployments
I see many examples of Grafana Loki memberlist.join_members configuration is set with all writes and reads deployments, including here https://github.com/grafana/loki/blob/v2.8.3/production/docker/config/loki.yaml#L24 My question: Is it possible if I want
community.grafana.com
2. Query 관련 모듈이 Grafana에서 보이지 않던 문제
– “검색 결과는 왜 간헐적인거지?”
증상
- Grafana에서 Loki Datasource는 정상 연결
- 하지만 Query Frontend / Scheduler 관련 메트릭이 전혀 보이지 않음
- 쿼리는 되기도 하고, 안 되기도 함
원인
Query 경로가 명확히 분리되지 않은 상태에서: Querier, Query Frontend, Scheduler 중 일부만 활성화된 상태였습니다.
특히 Frontend는 있는데 Scheduler가 없거나,혹은 반대로 Scheduler는 있지만 Frontend가 bypass 되는 구성에서 문제가 발생했습니다.
문제 해결
common:
compactor_grpc_address: "loki-compactor.ns-observability.svc.cluster.local:9095"
compactor_address: "loki-compactor.ns-observability.svc.cluster.local:3100"
- Loki의 쿼리 경로는 “자동으로 이어지지 않는다”
- Query Frontend / Scheduler를 쓸 거면 세트로 설계 해야 합니다.
- Grafana에서 보이는 메트릭은 “실제로 사용 중인 경로”만 반영되었습니다.
- 따라서 msa형식은 위와 같은 방식으로 compactor주소를 입력해 줘야 합니다.
관련 메트릭
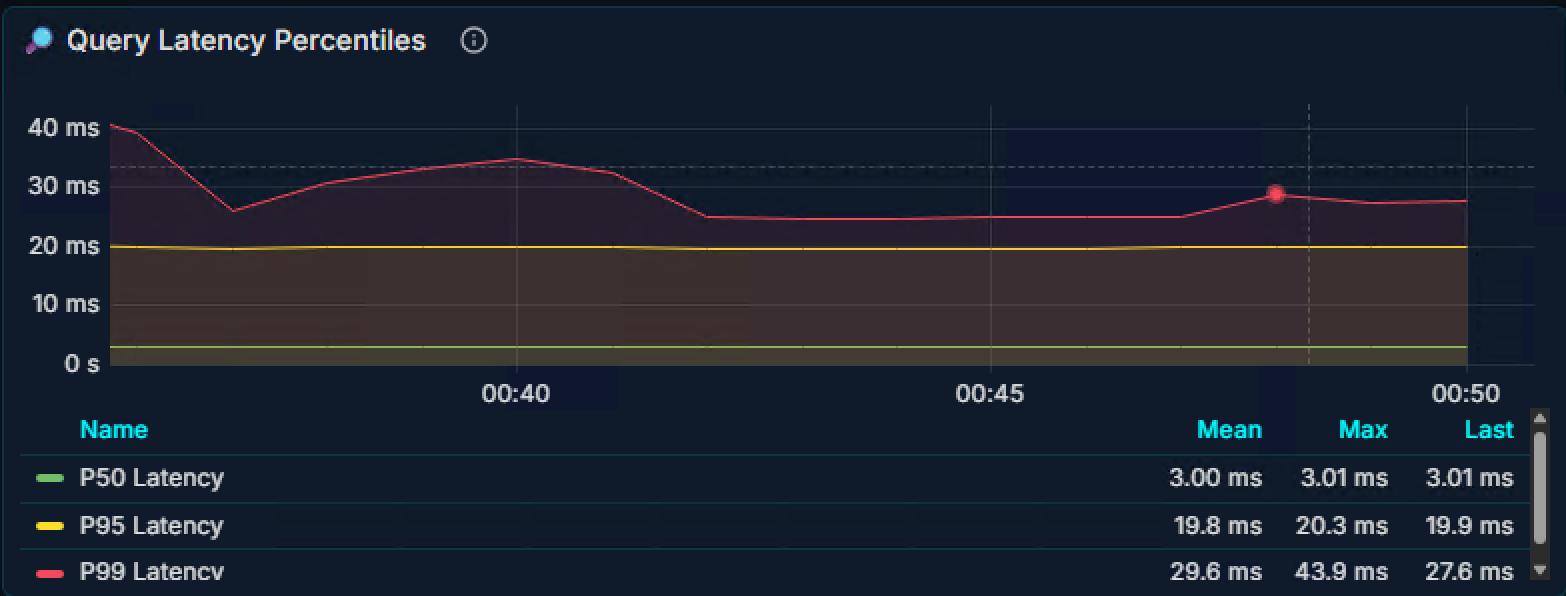
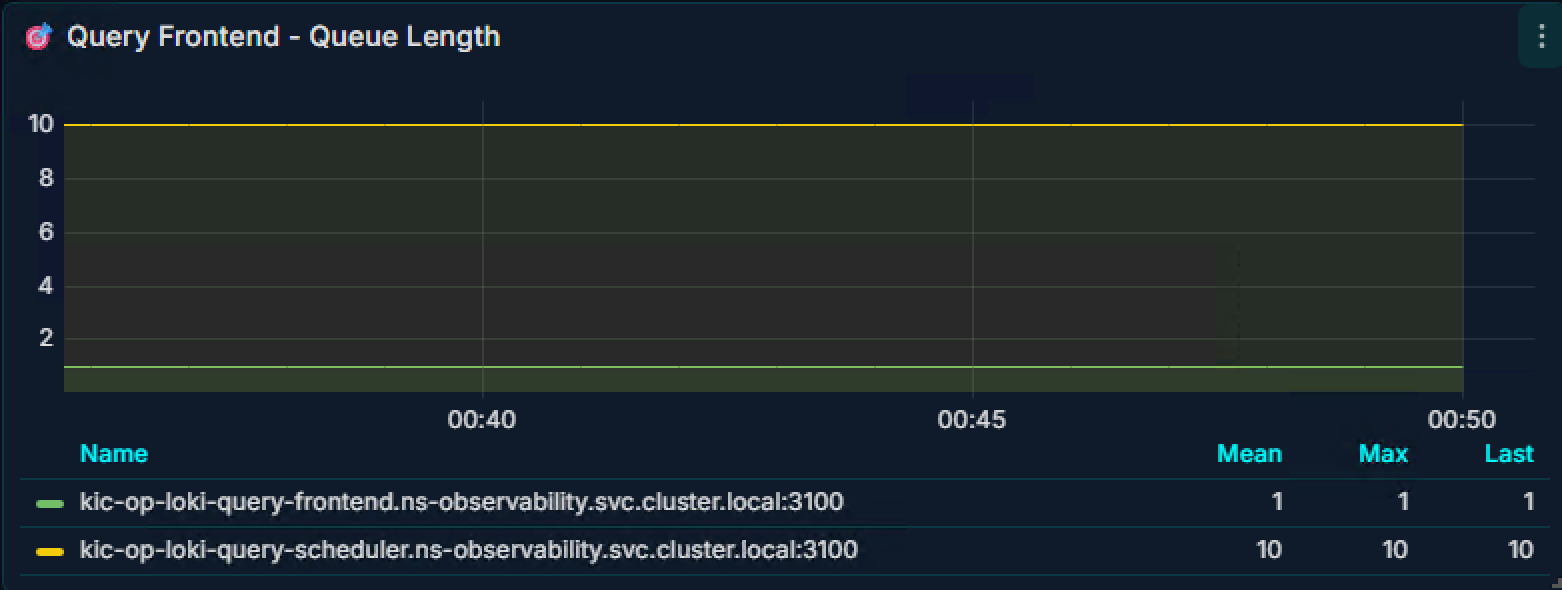
- 위 두개 메트릭을 통해 실제 쿼리 요청이 정상적으로 워킹하고 있는지 판별 가능하며 쿼리 프론트내에 요청도 확인 가능합니다.
3. PV Path 설정 문제
– "WAL은 쓰고 싶은데, 쓸 수가 없다"
증상
- Ingester에서 WAL 관련 에러 반복
- Pod 재시작 시 로그 유실 발생
- 디스크 용량은 충분한데 WAL write 실패
원인
PV는 붙어 있었지만:
- 실제 wal.dir 경로와 PV mount 경로가 일치하지 않음
- 혹은 permission 문제로 컨테이너가 쓰기 불가
Loki는 WAL을 굉장히 적극적으로 사용합니다. WAL 경로가 어긋나면 Ingester는 “반쯤 살아 있는 상태”가 됩니다.
문제 해결
- /var/* 형태로 모든 path를 변경하여 문제 해결 완료 했습니다.
- 기본적으로 PV 설정이 되어 있지 않기에 필요한 모듈들의 PV 설정이 모두 필요합니다.
- Ingester는 Stateless 컴포넌트가 아닙니다.
- PV 설정은 “붙였는지”보다 “정확히 어디에 붙였는지”가 중요 합니다.
- WAL 에러는 곧 데이터 신뢰성 문제 입니다. 따라서 로그 손실을 최소화 하기 위해서 꼭 필요합니다.
4. 트래픽 증가 시 버퍼 문제
– "조용하다가 갑자기 터지는 이유"
증상
- 평소엔 문제 없음
- 특정 시간대에 로그 적재 지연, 500 에러 발생
- Distributor / Ingester 메모리 급증
원인
2025-05-07T06:40:31.716832337Z level=error ts=2025-05-07T06:40:31.619528164Z caller=manager.go:50 component=distributor path=write msg="write operation failed" details="Ingestion rate limit exceeded for user fake (limit: 4194304 bytes/sec) while attempting to ingest '1736' lines totaling '2315634' bytes, reduce log volume or contact your Loki administrator to see if the limit can be increased" org_id=fake
트래픽이 늘어나면서:
- Distributor → Ingester 간 버퍼
- Ingester 내부 chunk buffer
- gRPC queue 문제
위 문제들이 한꺼번에 밀리기 시작했습니다. 특히 burst 트래픽에 대비한 설정이 부족했습니다.
limits_config:
ingestion_rate_mb: 300
ingestion_burst_size_mb: 600
문제 해결
- 평균 트래픽 기준 설계는 위험 합니다.
- Loki는 burst에 매우 민감 합니다.
- buffer / queue / limit 설정은 반드시 트래픽 패턴 기준으로 지속적인 파인 튜닝이 필요합니다.
5. Structured Metadata Labels 과다 문제 (Heavy트래픽 서비스)
증상
- 특정 서비스 로그만 적재 실패
- “too many labels”, “cardinality exceeded” 관련 에러
원인
level=warn ts=2025-04-29T05:06:06.700930094Z caller=grpc_logging.go:76 method=/logproto.Pusher/Push duration=2.550269167s msg=gRPC err="rpc error: code = Code(400) desc = stream '{exporter=\"OTLP\", service_name=\"unknown_service\"}' has too many structured metadata labels: '129', limit: '128'. Please see `limits_config.max_structured_metadata_entries_count` or contact your Loki administrator to increase it."
level=warn ts=2025-04-29T05:06:06.701194385Z caller=grpc_logging.go:76 method=/logproto.Pusher/Push duration=2.550846168s msg=gRPC err="rpc error: code = Code(400) desc = stream '{exporter=\"OTLP\", service_name=\"unknown_service\"}' has too many structured metadata labels: '129', limit: '128'. Please see `limits_config.max_structured_metadata_entries_count` or contact your Loki administrator to increase it."
JSON 로그에서:
- request_id
- user_id
- trace_id
- dynamic metadata
이 모든 것이 label로 승격되면서 Label Cardinality 폭발 발생
문제 해결
- Loki에서 Label은 “검색 편의”가 아니라 “인덱스 비용” 이라 생각해야 합니다.
- 구조화 로그 ≠ 구조화 Label (Label 전략이 필요함)
- Label은 최소화, 나머지는 chunk로 설정해야 합니다. Label이 많아지면 편하겠지만 여러 곳에 걸쳐 많은 영향을 줍니다.
6. S3에 저장되는 형태가 계속 fake로 보이던 이유
증상
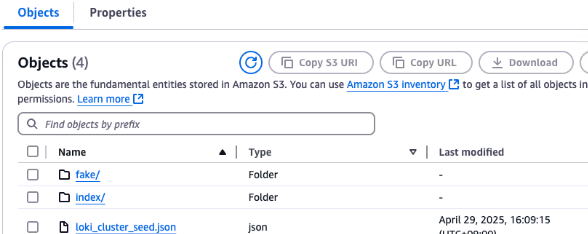
- S3에는 파일이 쌓이는데 실제 쿼리는 안 되거나 일부만 조회됨
- path에 fake/ 같은 prefix 존재
원인
[OUTPUT]
Name loki
Match loki-home-producer
Host kic-st-loki-distributor.ns-observability.svc.cluster.local
Port 3100
URI /loki/api/v1/push
Line_Format json
Auto_Kubernetes_Labels On
Labels job=service,agent=fluent-bit
Label_keys $log
tenant_id home-producer
- 초창기에는 Fluent-bit와 함께 운영했기에 tenant_id 설정 부재로 인해 Fake형식으로 저장되고 있었습니다.
문제 해결
- S3에 파일이 있다고 정상은 아닙니다.
- 조회 하는 대상을 명확히 하려면 tenant 설정이 꼭 필요합니다.
- service-name 설정도 어떤식으로 진행하면 효율적일지 고민해야 합니다.
7. Grafana Datasource 추가 시 409 Permission Error
증상
- Grafana에서 Loki Datasource 추가 시 409 에러
- 인증 정보는 맞는 것 같은데 연결 실패
원인
- 멀티 테넌시 환경에서 X-Scope-OrgID 헤더 누락
- 혹은 Grafana ↔ Loki 간 권한 정책 불일치
문제 해결
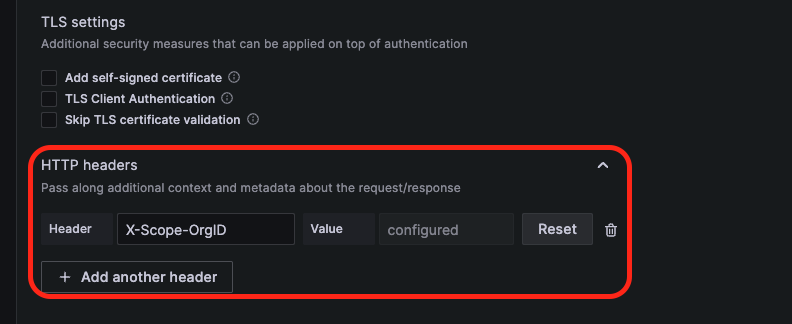
- Loki는 기본적으로 멀티 테넌시 전제 해야 합니다.
- Grafana 연결도 “단순 URL 연결”이 아닙니다.
- 적재 시작전에 OrgID 전략을 먼저 정해야 합니다.
결과 확인
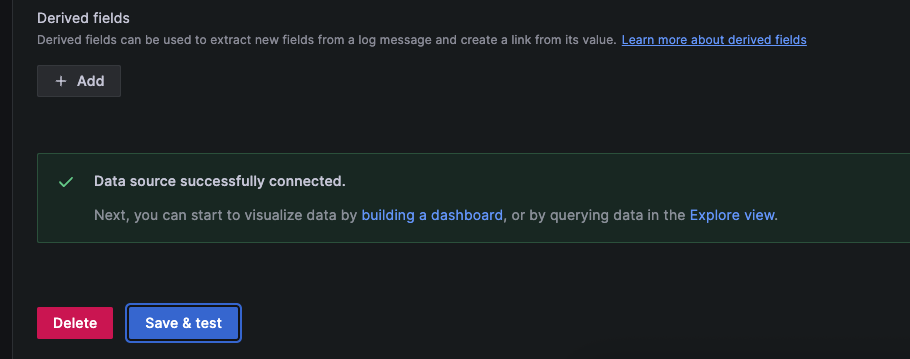
- auth 설정 이후 성공적으로 Datasource connection이 완료 되었습니다.
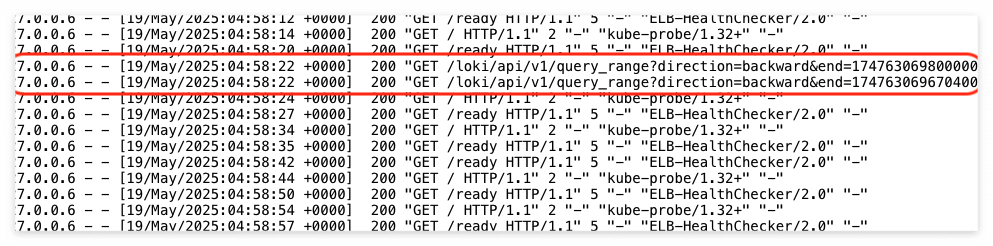
- auth 설정에 따른 X-Scope-OrgID 설정 이후 Query api, Label api도 모두 잘 동작 하는 것을 확인 할 수 있었습니다.
8. Compactor에서 Table을 찾지 못하던 문제
증상
level=error ts=2025-05-19T07:07:34.53212731Z caller=cached_client.go:189 msg="failed to build table names cache" err="NoSuchKey: The specified key does not exist.\n\tstatus code: 404, request id: ZYS2WTVECDDMC1ZQ, host id: fFfzOPh6KpaN0LtkC0ImbjVssRtQBgTtXf7GjzDlQ5FUsDM+omLoh+M/+qLpDENYeh/WP5FmcpQ="
level=error ts=2025-05-19T07:07:34.54245881Z caller=cached_client.go:189 msg="failed to build table names cache" err="NoSuchKey: The specified key does not exist.\n\tstatus code: 404, request id: ZYS8DP41S8FTQVFN, host id: AzXlggOfQ19T3xRlrq91T960rxkzZqPodFsciQ8BTV2csGOMGOmSVlcDjbmKipXeJ3QT2dR1zhA="
level=error ts=2025-05-19T07:07:34.542488355Z caller=compactor.go:548 msg="failed to run compaction" err="failed to list tables: NoSuchKey: The specified key does not exist.\n\tstatus code: 404, request id: ZYS8DP41S8FTQVFN, host id: AzXlggOfQ19T3xRlrq91T960rxkzZqPodFsciQ8BTV2csGOMGOmSVlcDjbmKipXeJ3QT2dR1zhA="
- Compactor 로그에 table not found
- retention / delete가 전혀 동작하지 않음
원인
- schema_config 설정 오류
- 실제 설정된 object_store Compactor 설정 불일치
문제 해결
schema_config:
configs:
- from: 2020-05-15
store: tsdb
object_store: aws -> s3 로 변경
schema: v13
index:
prefix: index_
period: 24h
- schema_config 설정 값이 aws가 아니라 s3로 설정 되어야 합니다.
- 또한 storage_config 에서도 동일하게 s3로 표시되어야 합니다.
결과

참고
- https://github.com/grafana/loki/issues/6590
- https://grafana.com/docs/loki/latest/operations/storage/tsdb/
Single Store TSDB (tsdb) | Grafana Loki documentation
Single Store TSDB (tsdb) Starting with Loki v2.8, TSDB is the recommended Loki index. It is heavily inspired by the Prometheus’s TSDB sub-project. For a deeper explanation you can read Loki maintainer Owen’s blog post. The short version is that this ne
grafana.com
failed to get s3 object: NoSuchKey: The specified key does not exist · Issue #6590 · grafana/loki
Describe the bug When trying to access log with grafana, Loki returns error message failed to get s3 object: NoSuchKey: The specified key does not exist.. To Reproduce Steps to reproduce the behavi...
github.com
9. AIC / EIC / QA 환경에서 S3 권한 오류
증상
level=info ts=2025-05-22T02:08:44.819391393Z caller=memberlist_client.go:588 phase=startup msg="joining memberlist cluster succeeded" reached_nodes=19 elapsed_time=94.505949msinit compactor: failed to init delete store: failed to get s3 object: WebIdentityErr: failed to retrieve credentialscaused by: SerializationError: failed to unmarshal error messagestatus code: 412, request id:caused by: UnmarshalError: failed to unmarshal error message00000000 3c 3f 78 6d 6c 20 76 65 72 73 69 6f 6e 3d 22 31 |<?xml version="1|00000010 2e 30 22 20 65 6e 63 6f 64 69 6e 67 3d 22 55 54 |.0" encoding="UT|00000020 46 2d 38 22 3f 3e 0a 3c 45 72 72 6f 72 3e 3c 43 |F-8"?>.<Error><C|00000030 6f 64 65 3e 50 72 65 63 6f 6e 64 69 74 69 6f 6e |ode>Precondition|00000040 46 61 69 6c 65 64 3c 2f 43 6f 64 65 3e 3c 4d 65 |Failed</Code><Me|00000050 73 73 61 67 65 3e 41 74 20 6c 65 61 73 74 20 6f |ssage>At least o|00000060 6e 65 20 6f 66 20 74 68 65 20 70 72 65 2d 63 6f |ne of the pre-co|00000070 6e 64 69 74 69 6f 6e 73 20 79 6f 75 20 73 70 65 |nditions you spe|00000080 63 69 66 69 65 64 20 64 69 64 20 6e 6f 74 20 68 |cified did not h|00000090 6f 6c 64 3c 2f 4d 65 73 73 61 67 65 3e 3c 43 6f |old</Message><Co|000000a0 6e 64 69 74 69 6f 6e 3e 42 75 63 6b 65 74 20 50 |ndition>Bucket P|000000b0 4f 53 54 20 6d 75 73 74 20 62 65 20 6f 66 20 74 |OST must be of t|000000c0 68 65 20 65 6e 63 6c 6f 73 75 72 65 2d 74 79 70 |he enclosure-typ|000000d0 65 20 6d 75 6c 74 69 70 61 72 74 2f 66 6f 72 6d |e multipart/form|000000e0 2d 64 61 74 61 3c 2f 43 6f 6e 64 69 74 69 6f 6e |-data</Condition|000000f0 3e 3c 52 65 71 75 65 73 74 49 64 3e 53 56 50 4b |><RequestId>SVPK|00000100 54 50 56 59 35 52 31 59 48 4a 53 4e 3c 2f 52 65 |TPVY5R1YHJSN</Re|00000110 71 75 65 73 74 49 64 3e 3c 48 6f 73 74 49 64 3e |questId><HostId>|00000120 38 53 72 31 6f 59 68 56 34 33 56 30 69 67 6d 42 |8Sr1oYhV43V0igmB|00000130 30 4f 58 75 34 67 64 48 48 2f 64 61 63 30 57 69 |0OXu4gdHH/dac0Wi|00000140 31 76 31 6f 41 4d 32 52 54 67 72 58 54 59 4e 75 |1v1oAM2RTgrXTYNu|00000150 7a 46 64 78 36 43 6d 6a 31 73 72 48 63 45 39 32 |zFdx6Cmj1srHcE92|00000160 57 37 63 38 6b 75 43 63 7a 62 38 3d 3c 2f 48 6f |W7c8kuCczb8=</Ho|00000170 73 74 49 64 3e 3c 2f 45 72 72 6f 72 3e |stId></Error>|
caused by: unknown error response tag, {{ Error} []}error initialising module: compactorgithub.com/grafana/dskit/modules.(*Manager).initModule/src/loki/vendor/github.com/grafana/dskit/modules/modules.go:138github.com/grafana/dskit/modules.(*Manager).InitModuleServices/src/loki/vendor/github.com/grafana/dskit/modules/modules.go:108github.com/grafana/loki/v3/pkg/loki.(*Loki).Run/src/loki/pkg/loki/loki.go:495main.main/src/loki/cmd/loki/main.go:129runtime.main/usr/local/go/src/runtime/proc.go:272runtime.goexit
- 특정 환경에서만 적재 실패
- 동일한 설정인데 환경별로 동작 다름
- IRSA 실패 문제 계속 발생함.
- 해당 문제로 Compactor가 계속 죽는 문제가 발생 함.
확인 사항
- AWS IAM내에 자격증명도 제대로 설정 되어 있었음.
- 특히 ListBucket, GetObject, PutObject 중 일부 누락 여부 확인.
- SA에 ARN을 추가해 S3에 접근 할 수 있도로 설정 되어 있고, 각 Pod들이 ServiceAccount Annotation도 붙어 있는지 확인.
문제 해결
aws:
s3: s3-an2-qa-loki
endpoint: s3.ap-northeast-2.amazonaws.com/
region: ap-northeast-2
s3forcepathstyle: true
insecure: false
endpoint: null # 추가
secret_access_key: null # 추가
access_key_id: null #추가
- 위와 같은 에러로 지속해서 실패하는 상황을 마주 하게 되었습니다. Github issue 케이스중 동일한 문제를 우연히 발견하여 최종 해결 가능 했었습니다.
- 근본 원인은 config하위에 설정된 SA 설정 값과, 하위에 컴포넌트 Helm-Chart 설정 값이 충돌 되는 문제 였습니다.
- endpint, Secret관련 옵션을 null로 명시하고 이후 부터 해당 에러가 없어졌습니다.
- 해당 문제 이후에 2시간 조회만 가능했던 상황에서 그 이후에 시간들도 조회(Query)가능해 졌습니다.
- Ingester참조 범위를 벗어난 sa권한을 통한 s3 Query가 가능해졌다는 것 입니다.
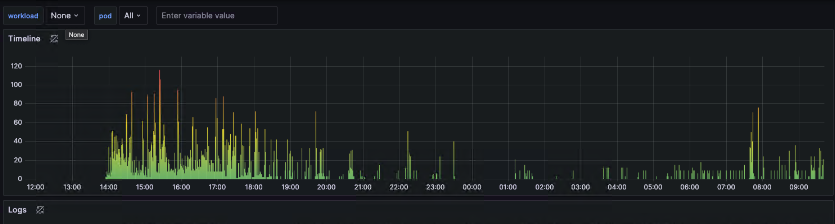
참고
- https://github.com/grafana/helm-charts/issues/1550
GitHub - grafana/helm-charts
Contribute to grafana/helm-charts development by creating an account on GitHub.
github.com
10. 적재 에러 및 500 에러 발생 이슈
2025-07-01T00:40:38.045573769Z level=error ts=2025-07-01T00:40:38.012673997Z caller=push.go:202 org_id=kic-qa-loki traceID=402e2cf8b733bd61
msg="negative structured metadata bytes received" userID=kic-qa-loki retentionHours=2160 isAggregatedMetric=false policyName= size=0
level=warn ts=2025-07-01T00:40:38.012882224Z caller=logging.go:142 trace_id_unsampled=402e2cf8b733bd61 orgID=kic-qa-loki msg="POST /loki/api/v1/push (500) 380.166µs"
증상
2025-07-01T00:57:01.593Z error internal/base_exporter.go:116 Exporting failed. Rejecting data. {"error": "sending queue is full", "rejected_items": 3}
go.opentelemetry.io/collector/exporter/exporterhelper/internal.(*BaseExporter).Send
go.opentelemetry.io/collector/exporter@v0.123.0/exporterhelper/internal/base_exporter.go:116
go.opentelemetry.io/collector/exporter/exporterhelper.NewLogsRequest.newConsumeLogs.func1
go.opentelemetry.io/collector/exporter@v0.123.0/exporterhelper/logs.go:176
- 간헐적인 HTTP 500
- 클라이언트에서 재시도 발생
원인
- Loki의 쓰기 거부 (Write Failure)
- Loki(Sink)가 데이터를 받아주지 않으니, 중간 전달자인 Collector에 부하 및 메모리 압박
- Loki replication 3으로 설정 되어 있는데 실제 ingester 갯수가 3보다 작았던 상태 였음
문제 해결
- replication_factor 3 -> 1로 줄이고 테스트를 위해서 줄여놨던 Ingester 모듈을 다시 늘려서 해당 문제를 해결했습니다.
- 이때 이후로 로그 유실 100% 보장하는 것을 유보하기로 결정했습니다. (99% 보장)
- 대용량 트래픽 시스템이기도 하고 수집 안정성 보다 비용을 더 높게 보았기에 인프라 비용을 최대한 작게 쓸 수 있는 방향으로 의사결정 했습니다.
11. 컴포넌트 Labeling 이상 문제
증상
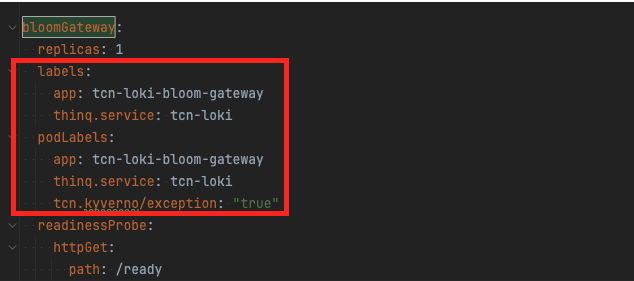
- Pod-labe이 제대로 명시되어 있는데도 불구하고 다른 컴포넌트의 라벨이 Overried 되어버리는 문제 발생
- 따라서 Istio를 통한 관찰성 모니터링도 불가능 상황 발생 됨.
- 이슈 레포트 : https://github.com/grafana/loki/issues/18417
Title: podLabels or labels from one component are incorrectly applied to others (e.g. ruler → querier/scheduler) · Issue #184
Describe the bug When applying podLabels or labels to the ruler component in values.yaml, those labels are unexpectedly applied to other components such as querier, query-scheduler, and ingester. T...
github.com
원인
- Helm-chart에서 다른 컴포넌트의 label overwrite
- 여러 컴포넌트에서 동일 key 사용
문제 해결
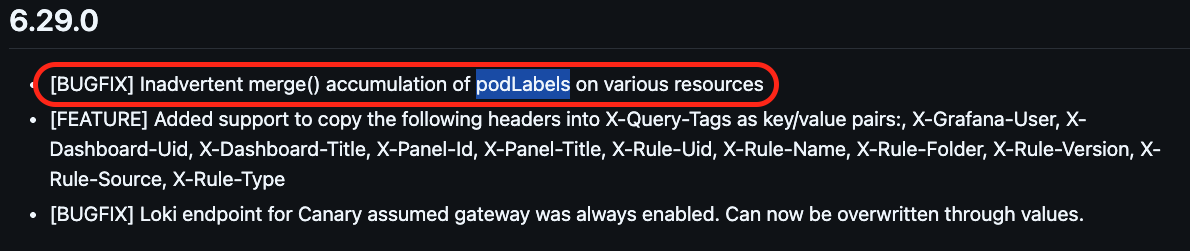
- Chart 버전 6.29.0에서 podLabels가 merge되는 현상 수정 됨.
- Chart 버전 6.28.0에서 6.31.0로 수정하여 해당 문제는 해결 되었습니다.
fix(helm): inadvertent accumulation of podLabels using merge by schahal · Pull Request #16700 · grafana/loki
What this PR does / why we need it: See this issue: the labels under .Values.write.podLabels suddenly appear in all deployments and statefulsets because they are inadvertently leaked into .Values....
github.com
추가 문제
- Pod 레벨에서는 Labeling이 되더라도 실제 Statefulset 레벨에서 라벨링을 하지 못하는 문제가 있었습니다.
- Helm Chart(value.yaml)로 더 이상 설정할 수 없는 상황 이였습니다.
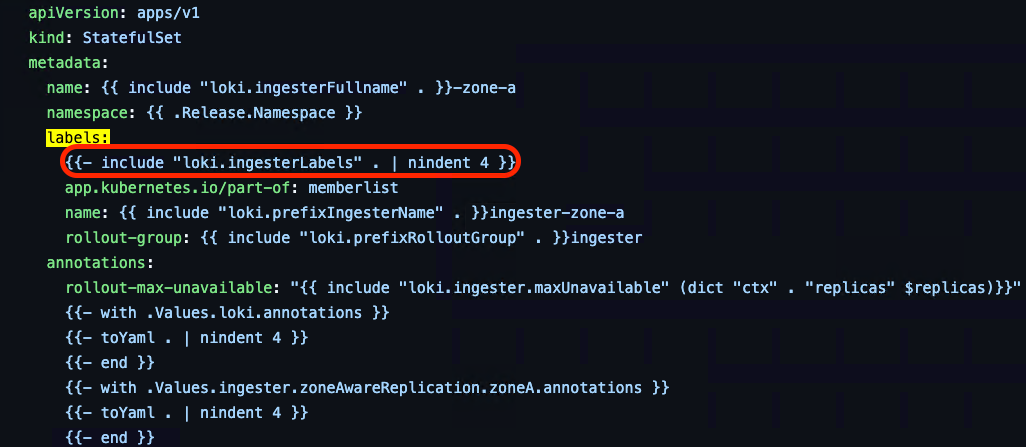
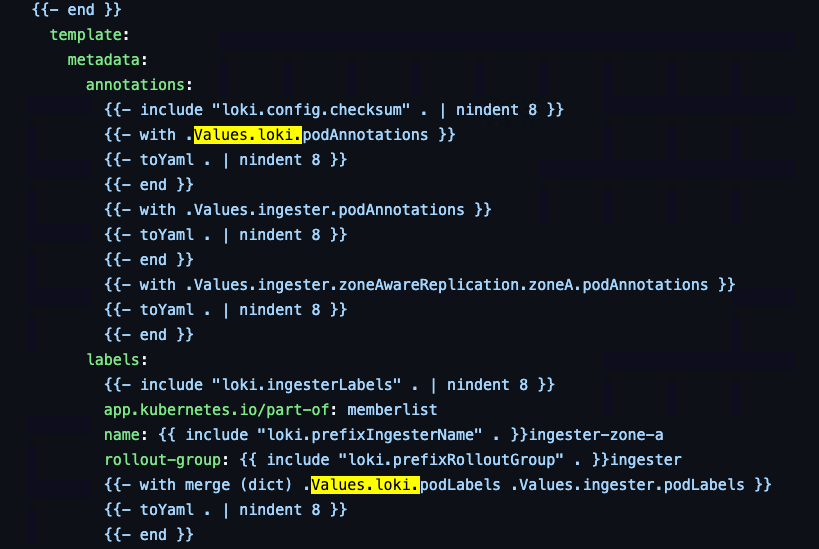
- Pod level에서의 labeling은 가능했었습니다.
- 참고 - https://github.com/grafana/loki/blob/main/production/helm/loki/templates/ingester/statefulset-ingester-zone-a.yaml
- 허나 Istio를 통해 컴포넌트간 관찰성을 확보하기 위해서는 Statefulset, 그리고 pod 양쪽 모두 라벨링이 제대로 되어 있어야만 Monitering 가능한 상태 였습니다.
- 따라서 kyverno를 관리하고 있는 동료에게 요청하여 webhook으로 라벨링 해줄 수 있도록 요청하여 최종 해결 했습니다.
loki/production/helm/loki/templates/ingester/statefulset-ingester-zone-a.yaml at main · grafana/loki
Like Prometheus, but for logs. Contribute to grafana/loki development by creating an account on GitHub.
github.com
12. Idle 상태 전환 후 쿼리 불가 문제
증상
- Query가 오랜시간 동안 일어나지 않는 경우 Query Component가 제대로 워킹하지 않는 문제.
- Memberlist가 제대로 워킹하지 않는 문제로 의심 중.
원인
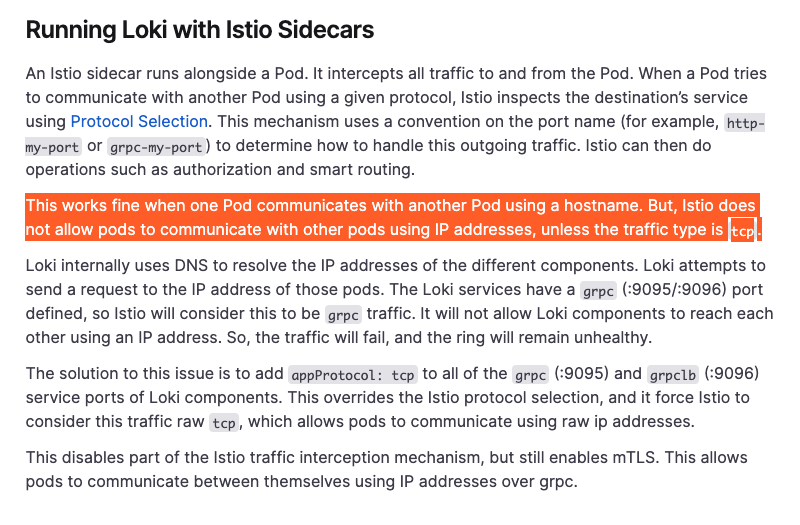
- 특정 컴포넌트의 상호 커뮤니케이션 중에 (grpc를 통해) Istio에 차단 되었을 가능성.
문제 해결
- Isitio 가이드에 따라 appProtocal명시(protocol이 명시되어 있으면 우선순위 처리)
Protocol Selection
Information on how to specify protocols.
istio.io
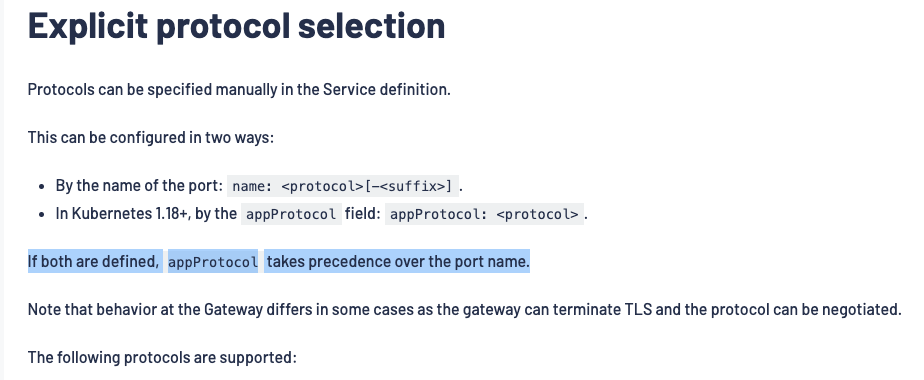
- Template 형태
- query.sertivece template
spec:
type: ClusterIP
ports:
- name: http
port: 3100
targetPort: http
protocol: TCP
- name: grpc
port: 9095
targetPort: grpc
protocol: TCP
{{- if .Values.querier.appProtocol.grpc }} # 해당 부분에 의해 protocol 명시
appProtocol: {{ .Values.querier.appProtocol.grpc }}
{{- end }}
- Memberlist 확인
- 예시) curl -i kic-qa-loki-querier.ns-observability.svc.cluster.local:3100/memberlist
- Consist HashRing 상태 확인
- 예시) curl -i kic-qa-loki-querier.ns-observability.svc.cluster.local:3100/ring
- 실제 Memberlist에서는 모든 컴포넌트가 등록 되어 있었기에 Memberlist에서는 문제가 없는걸로 판단 했습니다.
- 하지만 istio가 query-front와 querier 컴포넌트간의 grpc 통신을 막는 것으로 보이고 그에 따라 Grafana에서 아무런 데이터 조회가 되지 않는 것으로 판단했습니다.
- 해당 문제를 확인하고 Grafna 공식 가이드에 따라 appProtocol 설정을 해준 뒤다시 확인해 보니 쿼리가 잘 동작하는 것을 최종 확인 할 수 있었습니다.
13. Distributor 에러 메시지 지속 발생
증상
kic-op-loki traceID=462c6fe82da851f4 msg="negative structured metadata bytes received" userID=kic-op--loki retentionHours=4320 isAggregatedMetric=false policyName= size=0
* level=error ts=2025-11-14T08:37:09.880886785Z caller=push.go:202 org_id=kic-st-loki traceID=2c0435c0080b3b9a msg="negative structured metadata bytes received" userID=kic-st-loki retentionHours=4320 isAggregatedMetric=false policyName= size=0
- Json Parsing 하여 Message를 전달하여 적재 하고 있음.
- Distributor 로그에 위와 같은 에러가 계속 찍힘.
- "msg="negative structured metadata bytes received"가 지속해서 발생함.
원인
- 해당 버전에 버그가 있다는 Issue 케이스가 있었고 3.5.1 적용 이후 개선 되었다는 내용 확인.
문제 해결
- 3.5.1 버전 업데이트 이후 개선 완료 되었음.
| 업데이트 이전 | 업데이트 이후 |
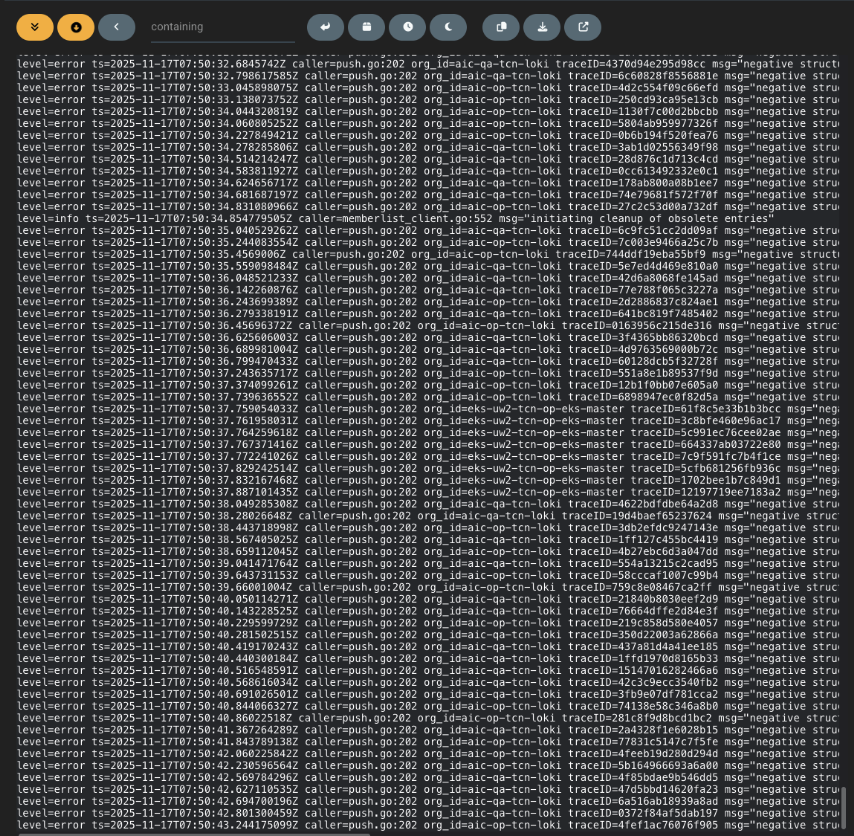 | 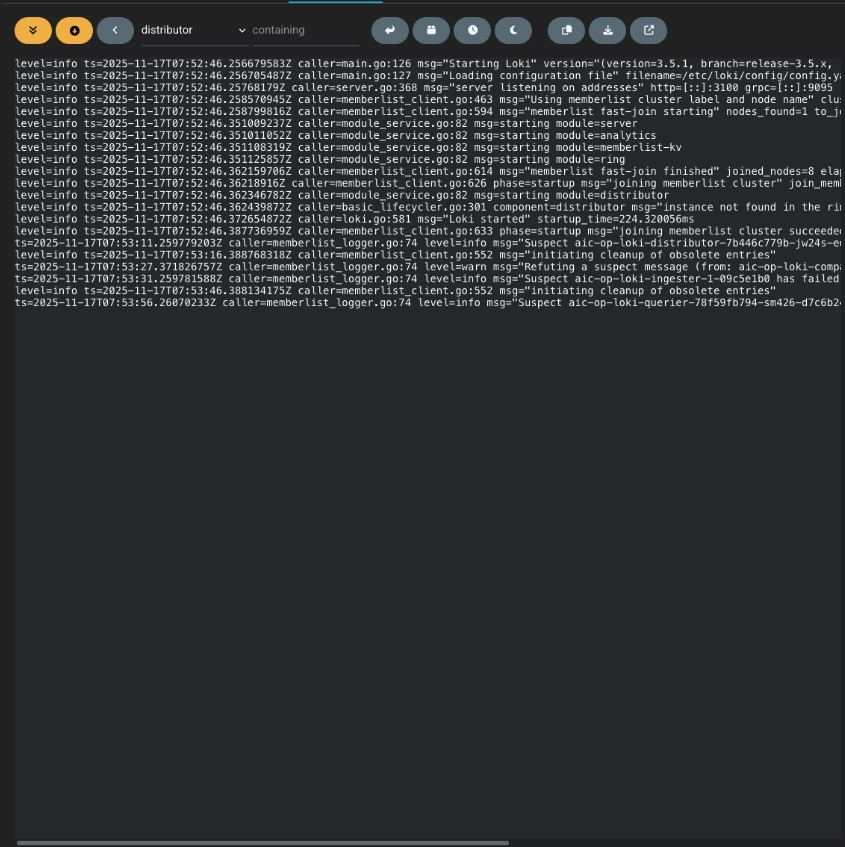 |
- 버전 업그레이드 이후 해당 증상은 추가적으로 발생 하지 않았습니다.
14. Ingester WAL 에러
증상
- 3.5.1 버전에서 wal 에러 문제 발생
building tsdb from old WAL files
github.com/grafana/loki/v3/pkg/storage/stores/shipper/indexshipper/tsdb.(*HeadManager).Start
/src/loki/pkg/storage/stores/shipper/indexshipper/tsdb/head_manager.go:284
github.com/grafana/loki/v3/pkg/storage/stores/shipper/indexshipper/tsdb.(*store).init
/src/loki/pkg/storage/stores/shipper/indexshipper/tsdb/store.go:130
github.com/grafana/loki/v3/pkg/storage/stores/shipper/indexshipper/tsdb.NewStore
/src/loki/pkg/storage/stores/shipper/indexshipper/tsdb/store.go:59
github.com/grafana/loki/v3/pkg/storage.(*LokiStore).storeForPeriod
원인
- WAL 복구시 에러 발생 후 복구 안됨.
- 비정상 종료 및 버그 발생.
문제 해결
- 3.5.5 부터 해당 문제 개선
- 옵션 추가
- replay_memory_ceiling: 5GB → 모든 데이터가 아닌 설정된 값을 배치형식으로 동작 수행.
- flush_on_shutdown: true → scale down시 flush 이후 종료.
Loki is unable to delete its WAL files of older schemas (CrashLoopBackOff) · Issue #13923 · grafana/loki
Describe the bug We encounter issues when restarting a loki-write pod. Upon startup, the pod always creates an empty WAL file, which it attempts to remove during shutdown. When the new pod starts a...
github.com
참고
- https://grafana.com/docs/loki/latest/operations/storage/wal/
- https://github.com/grafana/loki/issues/13923
- https://github.com/grafana/loki/issues/12583
Write Ahead Log | Grafana Loki documentation
Write Ahead Log Ingesters temporarily store data in memory. In the event of a crash, there could be data loss. The Write Ahead Log (WAL) helps fill this gap in reliability. The WAL in Grafana Loki records incoming data and stores it on the local file syste
grafana.com
15. 간헐적인 적재 누락 및 쿼리 실패(AZ통신 문제)
증상
- 적재 문제 발생(Otel-Gateway Log Drop 에러)
2025-12-17T05:18:08.895Z error internal/queue_sender.go:58 Exporting failed. Dropping data. {"resource": {"service.instance.id": "1c177257-44ae-43ce-941d-55287ff42f7a", "service.name": "otelcol-contrib", "service.version": "0.129.0"}, "otelcol.component.id": "loki", "otelcol.component.kind": "exporter", "otelcol.signal": "logs", "error": "interrupted due to shutdown: Post \"http://inlb-an2-op-t20-loki-0394e0bf10e86a61.elb.ap-northeast-2.amazonaws.com:3100/loki/api/v1/push\": read tcp 100.64.177.38:36238->10.150.166.80:3100: read: connection reset by peer", "dropped_items": 9}
go.opentelemetry.io/collector/exporter/exporterhelper/internal.NewQueueSender.func1 go.opentelemetry.io/collector/exporter@v0.129.0/exporterhelper/internal/queue_sender.go:58
go.opentelemetry.io/collector/exporter/exporterhelper/internal/queuebatch.(*disabledBatcher[...]).Consume go.opentelemetry.io/collector/exporter@v0.129.0/exporterhelper/internal/queuebatch/disabled_batcher.go:23
go.opentelemetry.io/collector/exporter/exporterhelper/internal/queue.(*asyncQueue[...]).Start.func1
- Grafana에서 쿼리시 Timeout 발생
<html> <head><title>504 Gateway Time-out</title></head> <body> <center><h1>504 Gateway Time-out</h1></center> </body> </html>
<!-- a padding to disable MSIE and Chrome friendly error page --> <!-- a padding to disable MSIE and Chrome friendly error page -->
<!-- a padding to disable MSIE and Chrome friendly error page --> <!-- a padding to disable MSIE and Chrome friendly error page -->
<!-- a padding to disable MSIE and Chrome friendly error page --> <!-- a padding to disable MSIE and Chrome friendly error page -->
NLB - > Timeout second 10 sec
원인
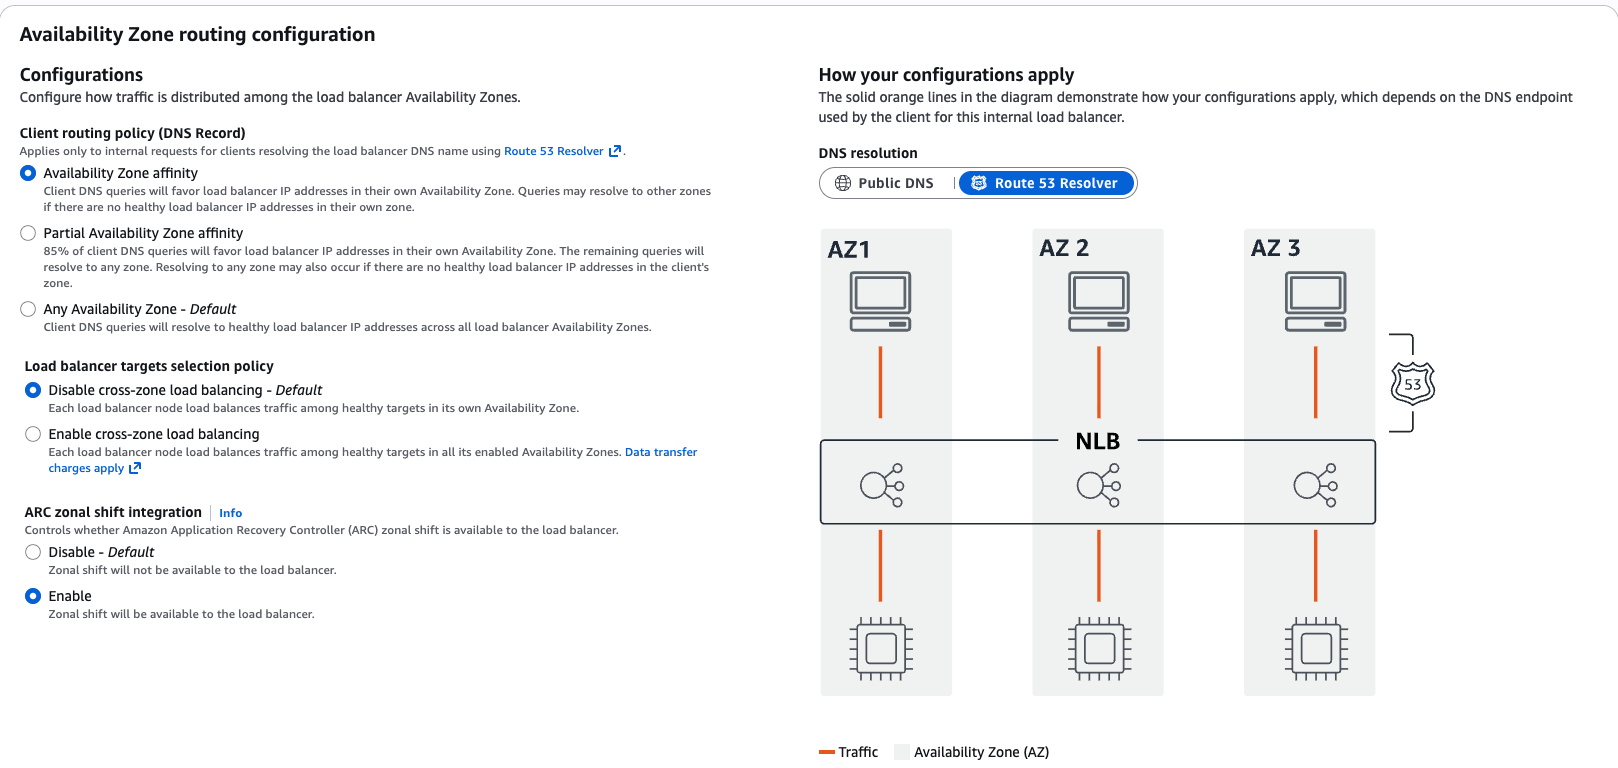
- 한쪽 권역(Grafana)에서 모든 권역의 Loki 데이터를 검색할 수 있도록 하기 위해 여러 측면을 고려하여(비용) NLB를 Endpoint로 설정 했었습니다.
- 하지만 NLB가 동일 AZ로만 트래픽이 가능하도록 하고 있어서 Distributor의 경우 다른 AZ에 몰려서 배포되는 경우 제대로 Log를 전송할 수 없는 문제가 발생되게 됩니다. (Cross AZ 비용 최소화)
- 역으로 Grafana를 통해 Query(조회) 할때도 동일 AZ에 Query-Front가 존재하지 않는 경우 해당 요청 제대로 처리 하지 못해 Timeout이 발생 할 수 있었습니다.
문제 해결
topologySpreadConstraints:
- maxSkew: 3-> 1 # AZ간 배포를 최소 차이로 배포되도록 하고
whenUnsatisfiable: ScheduleAnyway -> DoNotSchedule # 배포 설정을 강제화 하여 배포 편차를 최소한으로 줄이도록 합니다.
topologyKey: topology.kubernetes.io/zone
labelSelector:
matchLabels:
app.kubernetes.io/component: distributor
- maxSkew: 5
whenUnsatisfiable: ScheduleAnyway
topologyKey: kubernetes.io/hostname
labelSelector:
matchLabels:
app.kubernetes.io/component: distributor
- Distributor와 Query-Front의 topologySpreadConstraints 배포 설정을 강제와 하여 각 컴포넌트간의 부하를 AZ 기반으로 고루게 분산되도록 설정하여 Cross AZ가 최대한 발생하지 않도록 변경합니다.

- 해당 설정 이후 이전에 간헐적으로 발생하던 에러 상황은 개선 되었고, 그 이후도 안정적인 쿼리 및 데이터 수집이 가능 했습니다.
16. Lambda REST API 기반 적재 시 간헐적 4XX
증상
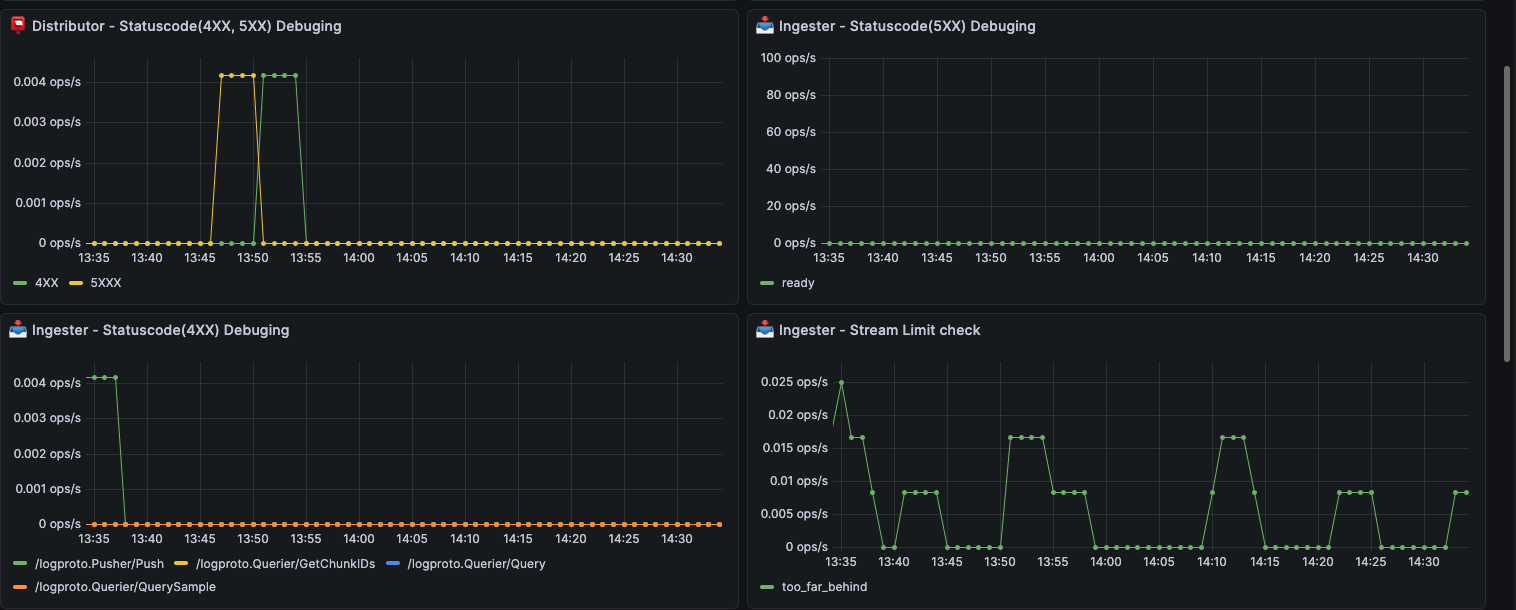
- 미세한 숫자이지만 로그 적재가 "too_far_behind"로 적재 거부가 되는 현상이 발생하고 있음.
- 이전에는 Late_limit에 의해 적재 거부가 발생했었지만 또 다른 문제임.
- Lambda에서 전송되는 케이스 중에 Timestamp가 역전되어 수집 요청 되는 케이스 발생
- Lambda Extention 에러 로그
Response body: entry with timestamp 2025-12-26 02:03:51.038000999 +0000 UTC ignored, reason: 'entry too far behind, entry timestamp is: 2025-12-26T02:03:51Z, oldest acceptable timestamp is: 2025-12-26T02:04:05Z', user 'kic-st-loki', total ignored: 1 out of 1 for stream: {from="Iot", geo_country_iso_code="KR", http_request_method="POST", http_response_status_code="200", log_severity="INFO", log_type="Response", service_name="service-api"
원인
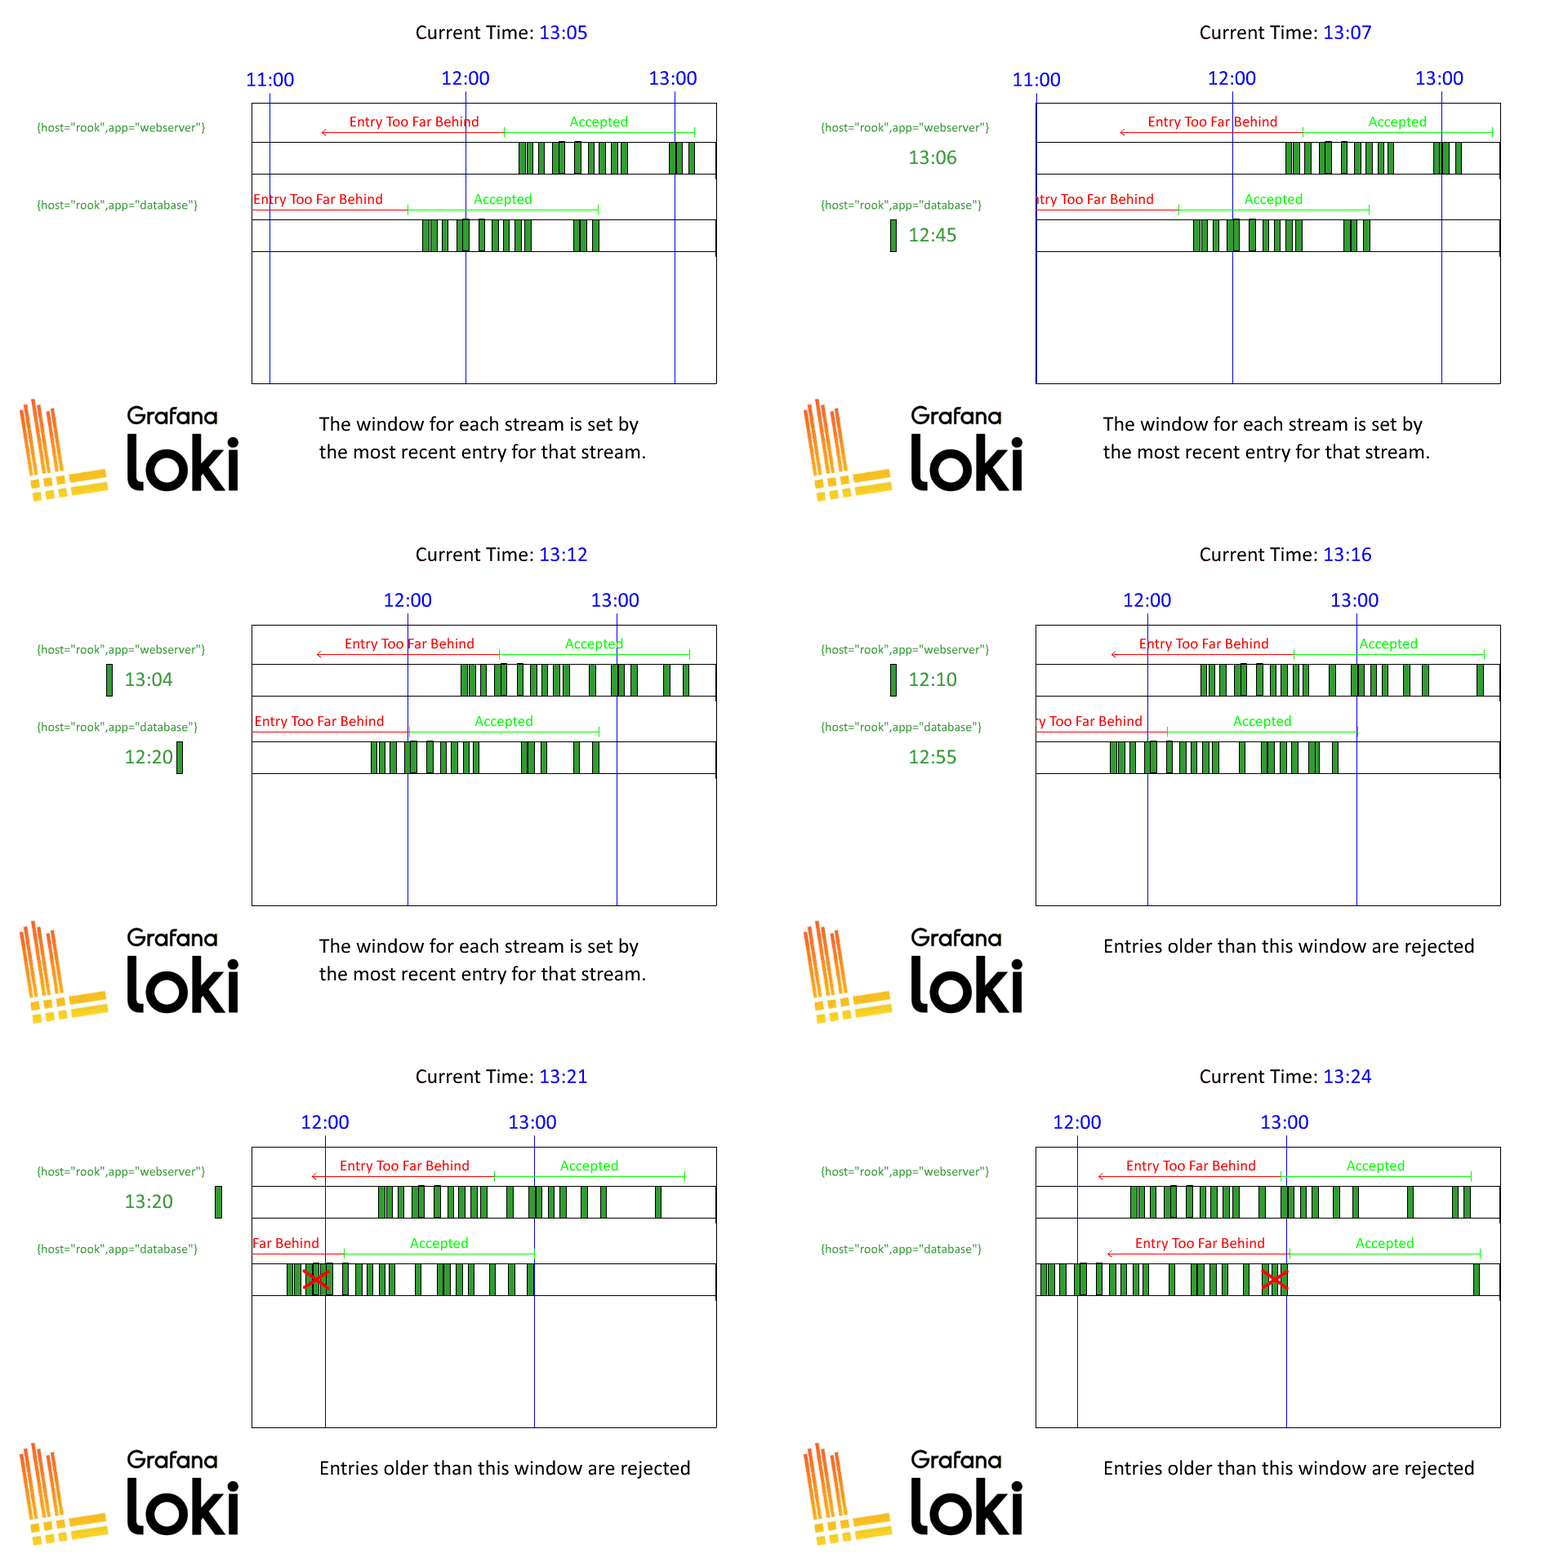
- 기본적으로 Otel-Collector로 수집되어 적재되는 케이스에서는Timestamp가 역전되는 상황으로 로깅 적재 요청이 없음. Lamda케이스에서 직접 Rest로 적재하는 형식에서 발생 가능성 높음.
max_chunk_age: 5m -> 15m
- max_chunk_age/2 값에 해당하는 경우 중 Timestamp가 역전되는 케이스가 발생하면 "too_far_behind"로 인지하고 로그를 적재 하지 않고 거부하고 있음.
문제 해결
- max_chunk_age: 10m으로 증가시켜 최대한 역전 되는 Timestamp 값을 허용하여 적재 하도록 하였습니다.
- 대용량 로그 형태로 갈수록 max_chunk_age와 query_ingesters_within 설정에 민감할 수 밖에 없습니다.
- 해당 설정이 수집 컴포넌트와 쿼리 컴포넌트의 의존성을 얼마나 가져갈 것인지 결정 되게 됩니다.
- 따라서 최대한 의존성을 줄이고 싶었지만 이슈를 그대로 둘 수 없기에 중간 정도의 타협점을 찾게 되었습니다.
(타임스템프 7분 30초 역전은 좀 ..... 이해 안되긴 하지만.... 현업은 늘 아릅답지 않습니다.)
참고
The concise guide to Loki: How to work with out-of-order and older logs | Grafana Labs
Learn how out-of-order ingestion works in Grafana Loki so you know what to expect when you need the log aggregation system to ingest older logs.
grafana.com
마치며
Loki는 지금 이 순간에도 Open Source 진영에서 빠르게 성장하고 있는 로그 시스템입니다.
한때는 대안이 없다고 여겨졌던 Elasticsearch 중심의 로그 아키텍처에서, 점차 비용과 운영 효율을 고려한 Loki 기반 구조로의 전환이 자연스럽게 이루어지고 있다고 느낍니다. 앞으로도 많은 조직들이 동일한 고민 속에서 Loki 전환을 검토하게 될 것이라 생각합니다.
저희 역시 급격히 증가하는 로그량과 함께, 더 이상 감내하기 어려운 비용 구조를 마주하며 Loki로의 전환을 시작하게 되었습니다. 다만 초기 구축 과정은 결코 매끄럽지 않았습니다. 버전별로 바뀌는 동작 방식, 문서만으로는 설명되지 않는 설정들, 그리고 실제 환경에서만 드러나는 제약들까지—단순히 공식 문서를 따라 하는 것만으로는 완성할 수 없는 영역들이 분명히 존재했습니다.
운영을 시작한 이후에도 크고 작은 문제들은 계속해서 나타났고, 그 과정에서 Loki는 “저렴한 로그 시스템”이 아니라 이해와 선택을 요구하는 시스템이라는 점을 점점 더 분명히 느끼게 되었습니다. 그럼에도 불구하고, 이러한 시행착오를 거쳐 설계와 운영 기준을 정립해 나가면서 지금의 구조는 충분히 합리적인 선택이었다고 생각하고 있습니다.
이 글들이 Loki 도입이나 전환을 고민하고 계신 분들께, 완성된 정답이 아닌 현실적인 참고 사례로서 작은 도움이 되기를 바랍니다. 🙏
'개발' 카테고리의 다른 글
| “Loki는 생각보다 단순하지 않았다” – 컴포넌트, 제약, 그리고 선택의 문제 (0) | 2026.01.16 |
|---|---|
| 우리는 Loki를 ‘어떻게’ 설계했는가 – 전체 아키텍처와 설계 원칙 (0) | 2026.01.05 |
| 왜 우리는 Elasticsearch 뒤로하고 Grafana Loki를 선택했나? (2) | 2025.12.31 |
| Fluent-bit Operator 적용 (0) | 2025.01.02 |
| 카프카 Re-Cap 👷 (1) | 2024.06.06 |